
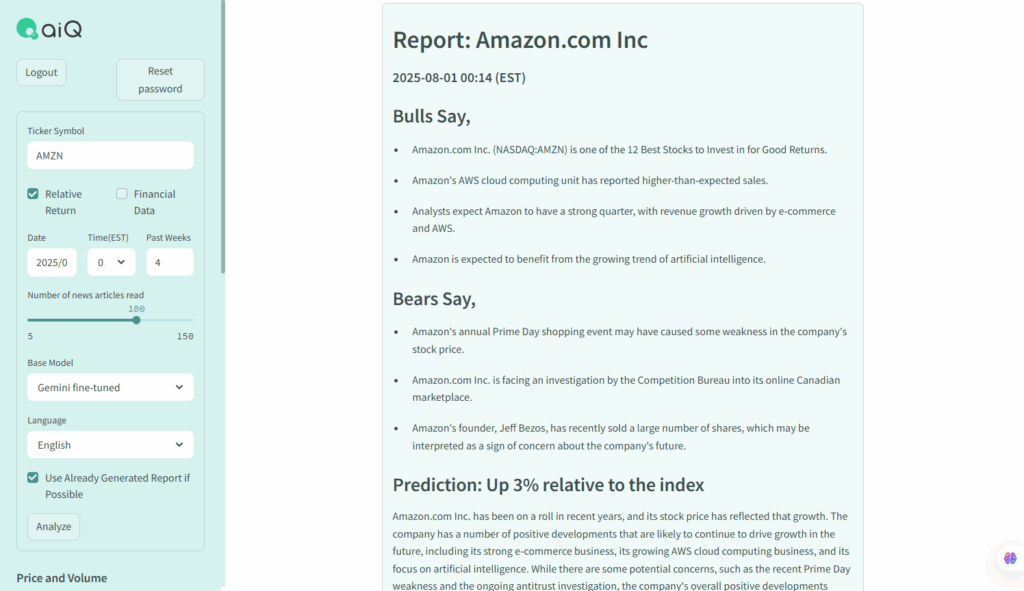
In today’s complex financial markets, efficiently collecting and analyzing reliable information remains a crucial challenge for making informed investment decisions. aiQ addresses this with Analystant, our innovative, generative AI-powered tool designed to automate analyst report generation and provide predictive insights.
Analystant: An Automated Analyst Report Generation Tool Using Generative AI
Analystant is our unique generative AI tool that analyzes vast volumes of news articles related to a specific stock. It categorizes and summarizes key news as either positive or negative. By integrating this intelligence, Analystant then generates a prediction for the stock’s one-week price change, expressed as its relative performance against the broader market.
This time, we will introduce the results of backtesting in three case studies to objectively demonstrate the effectiveness of Analystant’s predictions.
About Backtesting
In backtesting, we verified the cumulative results of the following simple investment strategies based on Analystant’s predicted values:
- Long Position (Buy): If Analystant’s predicted value for a stock is above +2%, a long position is taken for one week.
- Short Position (Sell): If Analystant’s predicted value for a stock is below -2%, a short position is taken for one week.
The base model of the generative AI is Llama 3. It was released just prior to the testing period, ensuring that all backtesting was conducted strictly without the use of future information.
Backtesting Results Examples
For this analysis, we selected stocks to represent a diverse range of market conditions and news volumes. Amazon.com, Inc. (AMZN), a top-tier S&P 500 constituent, typically has abundant daily news. Humana Inc. (HUM) and Johnson Controls International plc (JCI) were selected from the mid-tier, representing companies with potentially less frequent news and stock prices that experienced both downward and upward trends during the period. This selection aims to demonstrate Analystant’s robust performance across varied scenarios without bias.
Case Study 1: Amazon.com, Inc. (AMZN)
Amazon, which operates a wide range of businesses from e-commerce to cloud services, reports an enormous amount of news daily. Analystant extracted important signals from this complex information and reflected them in its predictions. The following graph shows the cumulative trend of positions taken (long, short, no position) at the beginning of each week and the resulting returns during the period from Monday, September 9, 2024, to Monday, May 5, 2025.
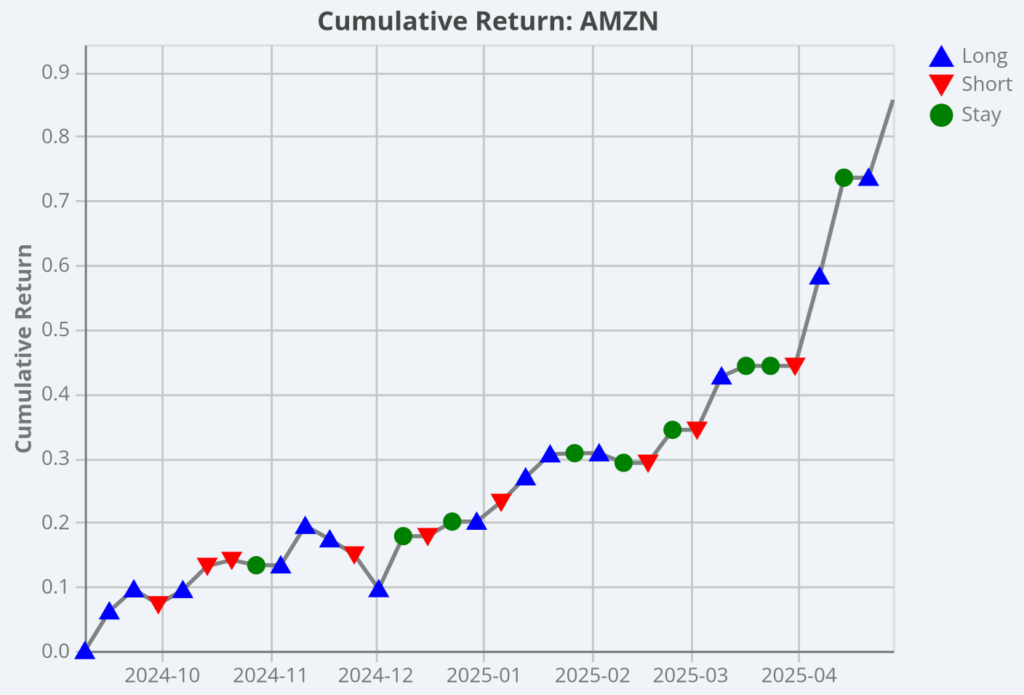
As a result of backtesting, it significantly outperformed the market and stock price movements. Although there was a slight loss in the first half of the period, it generally accumulated positive returns steadily. Especially in the latter half, it significantly increased returns mainly through short selling by capturing downward trends. It was suggested that there were not many cases where the predicted value was “Stay (continue holding)”, indicating that signals were accurately captured.
Case Study 2: Humana Inc. (HUM), a Major US Life Insurance Company
Trends in the healthcare industry are complex, and changes in regulations and the competitive environment have a significant impact on stock prices. Analystant analyzed news regarding Humana and incorporated the company’s strategies and market changes into its predictions.
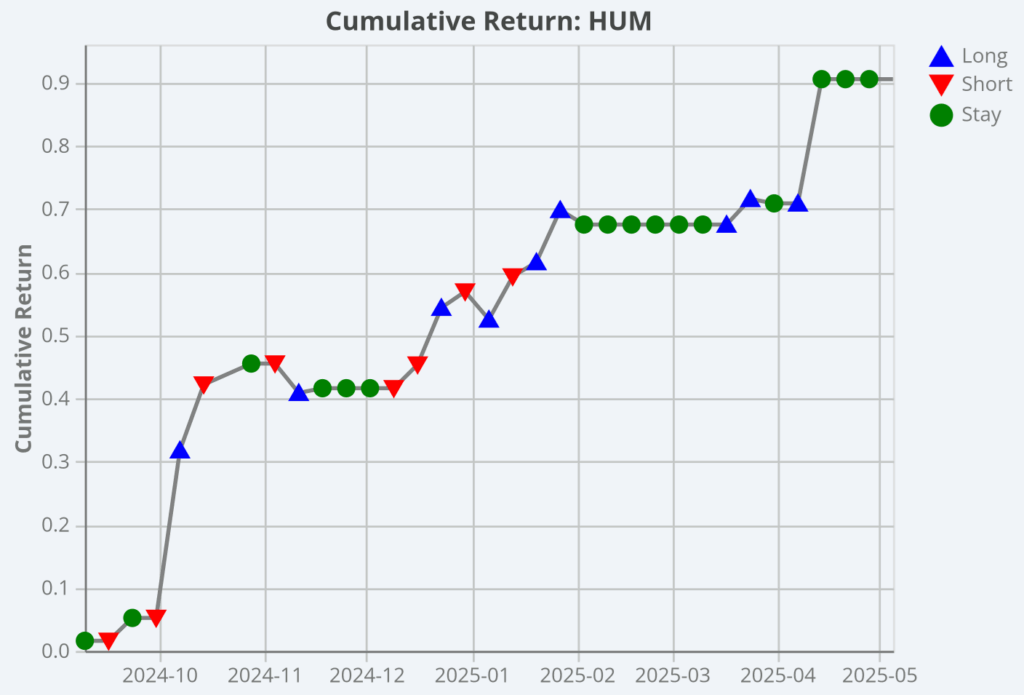
For Humana’s stock as well, the investment strategy based on Analystant’s predictions significantly outperformed the market. While the stock price declined by about 30% over the entire period, signals were captured for both long and short positions, resulting in significant cumulative returns.
Case Study 3: Johnson Controls International plc (JCI)
Johnson Controls is a company that specializes in seemingly niche areas, such as building facilities and security. Analystant accurately evaluated news related to the company’s business and predicted the direction of its stock price.
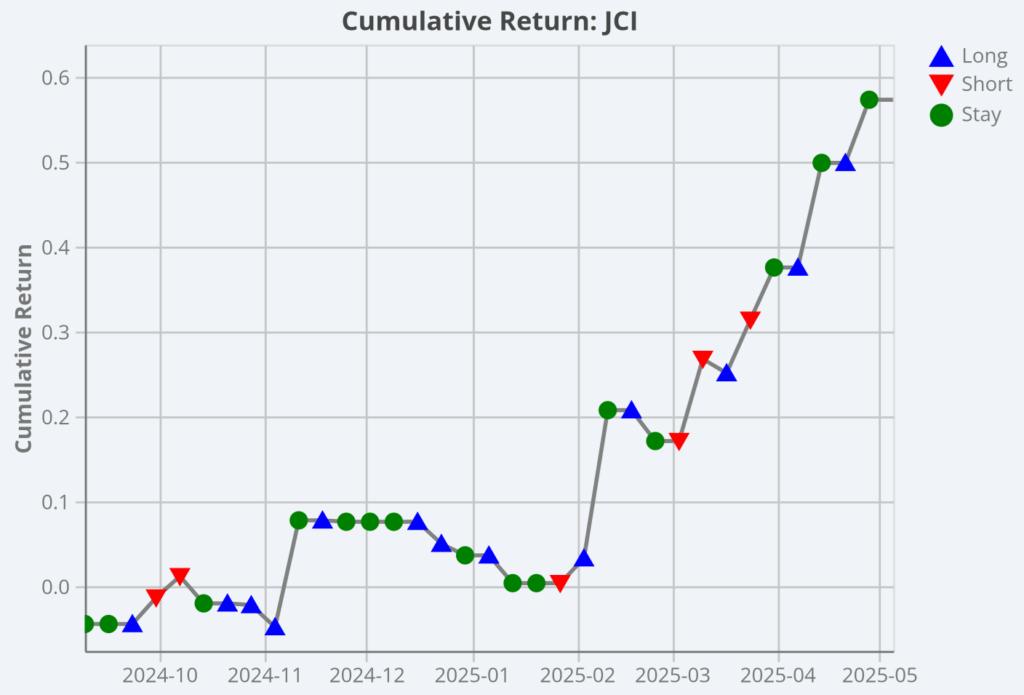
Backtesting revealed a high correlation between this prediction and actual stock price fluctuations, demonstrating that Analystant’s analysis is effective even in specialized markets. It significantly outperformed the market and stock price movements. In the early part of the period, cumulative returns were limited due to small price movements, but they steadily captured opportunities with larger price movements. From the latter half of the period, when price movements became more pronounced, it captured signals in both long and short positions, resulting in significant returns.
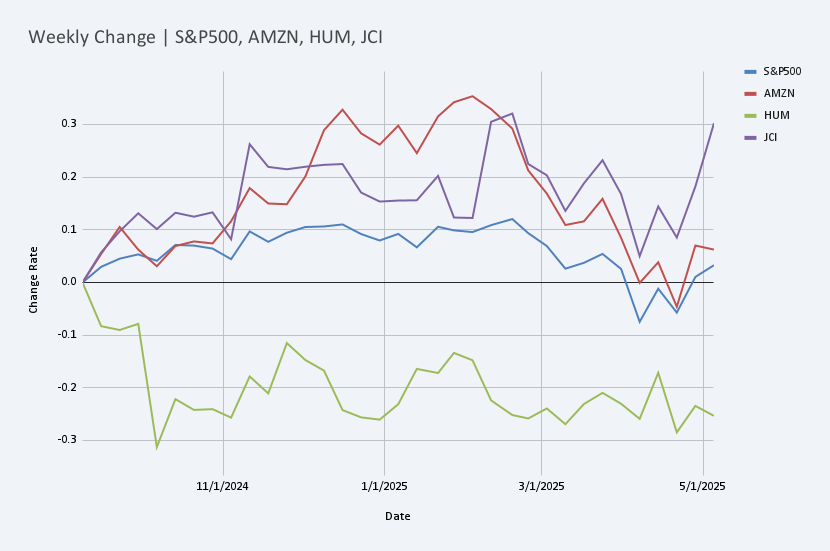
Benchmark and Individual Stock Performance
The graph below displays the performance trends of three sample U.S. stocks (AMZN, HUM, JCI) and the S&P 500 index, which represents the overall market during this backtesting period. Compare this with the backtest results for each stock shown above. You can see that the investment strategy based on Analystant’s analysis has outperformed.
Future Outlook for Analystant
These backtesting results demonstrate that Analystant is an effective tool for predicting market directions. Analystant supports investment efficiency and, at the same time, helps to gain a deeper understanding of the background of important information through reports. Moving forward, we aim to enhance service value through functional expansions such as:
- Support for Japanese Stocks: Enable analysis of Japanese stocks in addition to US stocks.
- Addition of Diverse Data: Incorporate additional data sources, such as alternative data, in conjunction with news articles.
- Flexible Customization: Consider linking with customers’ proprietary data and tuning to individual investment policies.
If you are looking for more efficient and accurate investment analysis, please feel free to contact us.